I'm Chelsea Donaldson and I am a fifth-year teacher. I teach in a digital 1:1 learning environment and am passionate about using technology to engage and extend my learners. I'm all about making my lessons
engaging and fun, and creating a safe, inclusive and happy
classroom. This year I am teaching an awesome class of year 5 & 6 learners at Glen Innes School, and documenting my learning along the way.
I've previously taught year 7 & 8 students.
I have been using Nearpod as a way of engaging my learners and building on their knowledge of stormwater pollution. They absolutely love it. Whenever we use Nearpod the students are so much more engaged and eager to participate in the learning. We have done a lot of learning so far about stormwater pollution and our local river - Omaru River. I wanted to come up with an exciting way for my learners to show me what they have learnt so far.
Since they love taking part in quiz-type presentations like Nearpod, I decided that they could create their own quizzes to show me what they have learnt.
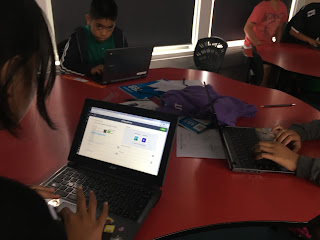
My learners loved this idea and immediately began creating their own tasks. Since Nearpod is actually created for educators, I gave students two platforms to choose from:Kahoot! and Socrative. All students ended up choosing Kahoot! because it is very user friendly.
Creating Quizzes
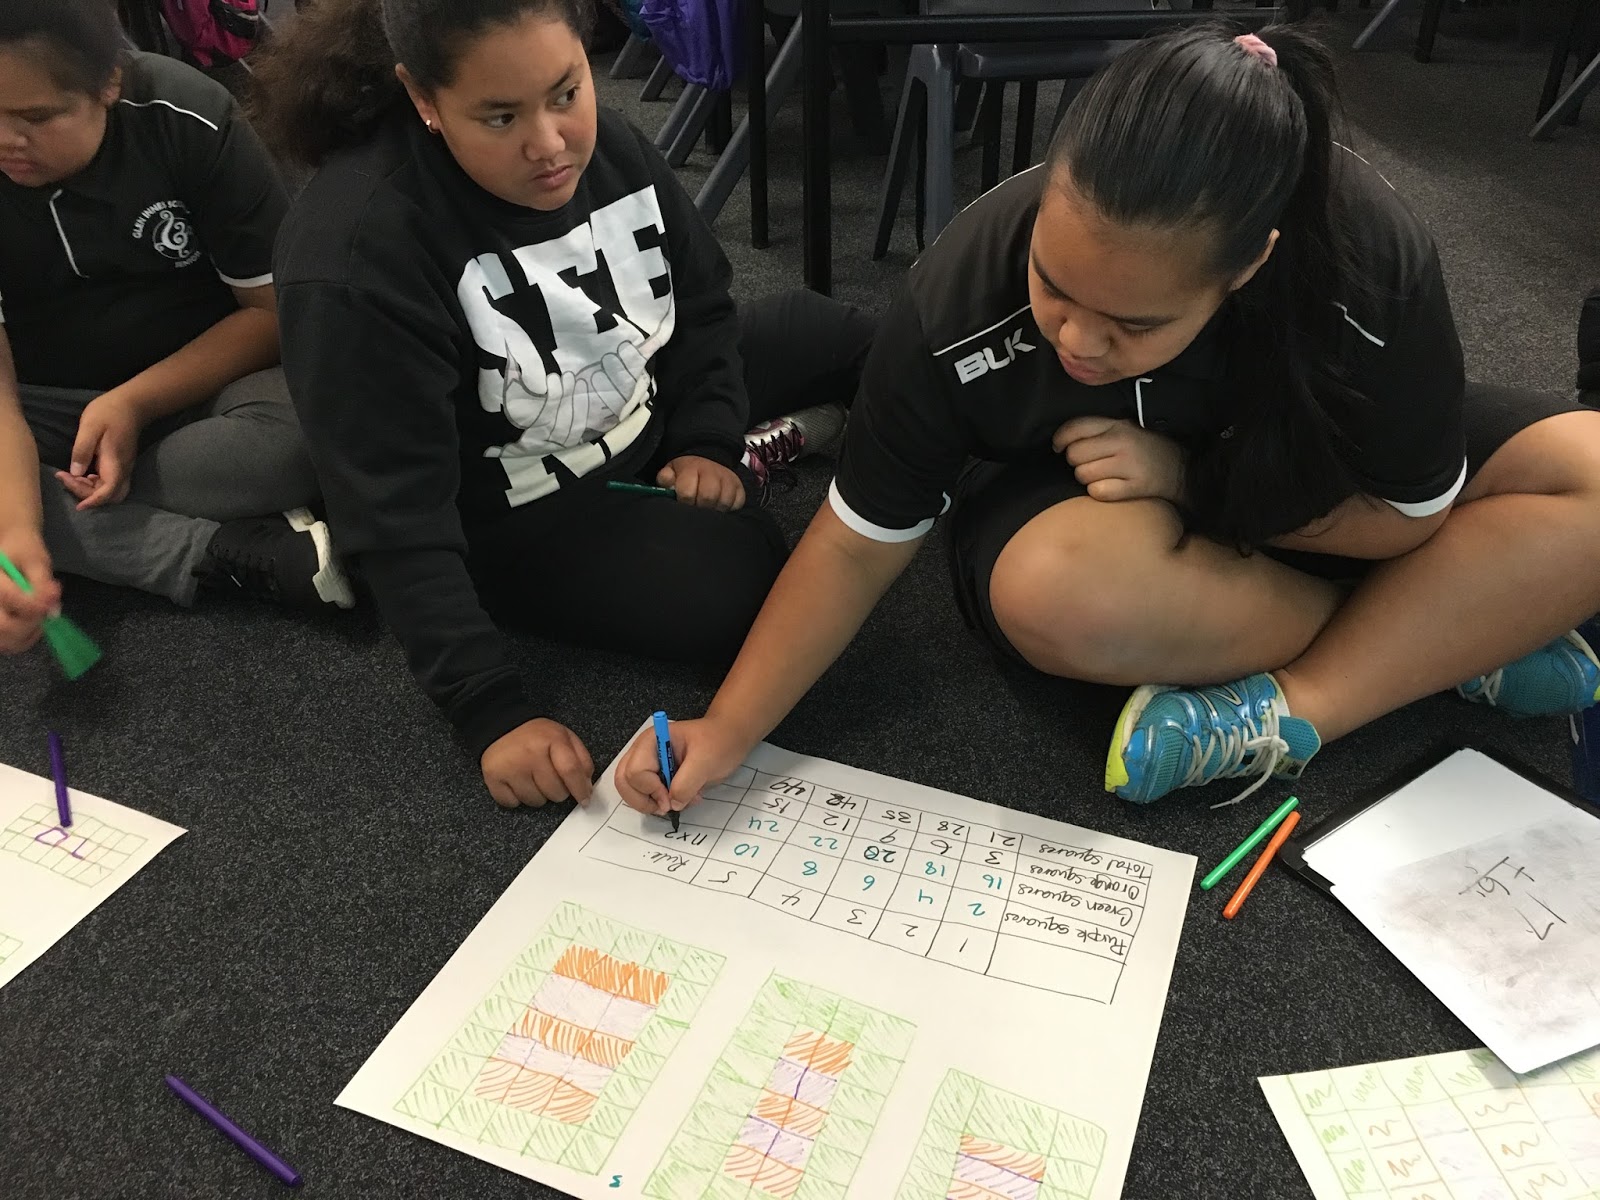
It was interesting to see the types of questions and answers my learners were creating. I think creating a quiz added an extra element of difficulty. Not only did they have to come up with a question and an answer, but also other plausible but incorrect answers too. My learners seemed to enjoy the challenge though! When some students became stuck I modelled a couple of example questions on the board. This helped to make a connection between what they had learnt and how they could use it in a question/answer form for the quiz.
Quiz time
After looking through the quizzes, I am pretty pleased with how they turned out. They show that my learners have actually learnt a lot about stormwater pollution and our river. The next part of the activity is to have a go at eachothers quizzes. Stay tuned to see how the learners respond to having a go at eachothers quizzes!
It is crazy to think that I have almost completed my first year as a beginning teacher in the MDTA. I have learnt heaps and grown a lot. Here is my doco where I talk about my beliefs, the MDTA programme and how I use Manaiakalani's 'Learn Create Share' pedagogy. Thanks to Dorothy Burt, Anne Sinclair, Fiona Grant, the MDTA BTs and the team at Glen Innes Primary who have helped me on my journey! I am looking forward putting my learning into practice into my own class next year.
Today we had a chance to learn how to code using code.org's Hour of Code lessons. In these lessons you learn 'computer science' by understanding how to code to create games. You can learn more about code.org and their aspirations here. In Hour of Code, you can choose from a range of lessons based on popular games or movies (such as Flappy Bird, Starwars, MineCraft and Frozen). This is great for learners as they can choose a game or movie that they are interested in. There are two options for the lessons, blockly (for beginners) and Javascript (for advanced coders). I chose MineCraft which uses blockly for my first attempt at Hour of Code.
The lesson
Once you have choose your lesson and type of code, you watch a short YouTube clip that explains the coding suite and its functions. You work through ten tasks before creating your own code.
My code
My verdict
I enjoyed completing the tasks and creating my own code. The instructional videos helped make sense of coding. I enjoyed the aspects of problem solving and trial and error which arose when trying to complete the tasks. To start with I run my code after one or two blocks, however as I improved I began to create more code before checking to see if it worked. This made me think carefully about what I was asking the game to do. One thing that bothered me is that you always have to run your code from the start. This gets a little frustrating when you have a lengthy code and only want to check the last few blocks.
Aside from that, I think students would benefit from learning how to code. At this point I am not sure when/how I would fit coding into my timetable. I may start this as an early finishers task or allocate 30 minutes of inquiry time to coding.
The 'learn' component of this weeks digital immersion was all about ubiquitous learning. This is about ensuring that our students can access their learning anytime, anywhere and any place. E-Learning and the use of Google Sites (that are open to anyone) allows for extended learning times.
How learning is ubiquitous for my students
Class Site
As we are a part of the Manaiakalani cluster, all schools and classrooms are required to have a Google Site, which is accessible to all. In Manaiakalani schools the expectation is that learning is visible. This means that every link needs to have the sharing permissions as "anyone with the link can view". To make this easier we create a main folder in our Google drive that has the permission "anyone with the link". This means that
Screencasts
I have recently created a Google site for reading and writing. To help ensure my students understand everything, I have included a range of screencasts. The screencasts help to the explain tasks and reading comprehension strategies
Teaching DLOs
I always ensure my teaching DLOs are linked into our class site. These DLOs are quite comprehensive and cover everything I am planning to teach. This enables my learners to revisit the learning anytime they need.
'Modelling Books'
They are not quite modelling books, but they are my take on it. Whenever we are learning something, I take photos of the students work. This is then uploaded onto a shared folder onto Google drive, which the students have full access to. A next step would be for me to add these folders to the site.
On Friday the MDTA were very lucky to attend Manaiakalani's 5th annual Hui - a place where teachers and learners across Manaiakalani celebrate and share their accomplishments.
This has ended up being a rather lengthy post, as I gained many new insights from the teachers, researchers and learners at the hui.
In the morning
First up we heard our Manaiakalani student ambassadors share their learning. It was really interesting to hear from students how they learnt in their school. What I like about Manaiakalani is that every school is different. Although we are all following Manaiakalani's 'Learn, Create, Share' pedagogy, each school is able to put their own spin on it to reflect the community they are in. There were plenty of ideas that I will borrow and repurpose in my classroom, like the use of a 'Goal Wall' to make goals visible to learners.
Following this, the Manaiakalani Innovative Teacher's shared their inquiries with the insights they gained along the way. I came away feeling inspired to give my own teaching programme a shake up to ensure my lessons are engaging, motivating and using digital technologies as much as possible. Whilst I do believe I use technology a lot in the classroom, these teachers had come up with ideas that I had not thought of before. Check out my infographic to see my main takeaways from the MIT.
Next up
After morning tea we heard from Rachel Williams about her holiday intervention programmes 'Summer Learning Journey' and 'Winter Learning Journey'. Rachel's aim is to help lesson the 'summer drop off', where learners achievement declines between T4 and T1 after the school holidays. Her results show that students who participated in the 'Summer Learning Journey' had less of a drop compared to students who did not participate in the intervention. Rachel's data was very compelling and I am excited to encourage my learners to participate in 'Summer Learning Journey 2.0'.
Next Woolf Fisher researchers, Rebecca Jesson, Stuart McNaughton and Aaron Wilson shared their insights gathered from observing teachers, and challenged us to consider what we are doing to accelerate our learners achievement.
Lastly
Dorothy, Russell and Pat Snedden spoke about where we are now and where to next for Manaiakalani. Although we are doing a great job accelerating our student's achievement, we need to continue to reflect, refine and improve our teaching. We have a series of outreach clusters which are looking at us and using what we are doing to accelerate their learners achievement too. Therefore, we need to be at the forefront of change and be constantly seeking ways to help our learners achieve. Pat Snedden's talk was the most inspiring of the day. He is so passionate about lifting our learners out of subsistence to capital builders. I think Pat Snedden gave me the kick I needed to ensure that I am constantly doing my best and seeking ways to improve my teaching, because it is what my learners deserve.
I also used Twitter when I heard something which resonated with me. Here is a collation of my tweets from the Hui.
Today for Digital Immersion we were lucky enough to have Point England teacher and GarageBand guru Rob Wiseman join us to take us through GarageBand. We went through all the basics of GarageBand like cutting and editing audio recordings, GarageBand shortcuts and creating our own music. I wrote some notes of the tidbits I found useful, which you can find here.
Creating in GarageBand
Our challenge was to create some music to use with a video we had captured during the week. I chose to use a video I took of the Zirka Circus performers that came to GIS on Monday. The quality of the video is a little poor and the music is a little odd, but I felt it matched with the performers actions and their costumes. I might refine it a little more by using iMovie to cut and match the song to the movements of the performers, but for now this will do!
Unfortunately I was absent during last Friday's Digital Immersion day, recovering from a procedure on my jaw. After looking at Dorothy's presentation and blog post, and the blog posts from the rest of the MDTA team, I knew I missed out on an awesome learning opportunity!
Creating to share with infographics
The create aspect of the day was about creating to share using infographics. Infographics are a visual and fun way to present statistics. It goes without saying that people respond better to visuals than a lengthy piece of writing. The average human attention span is only 8 seconds, and our brains process visuals 60,000 times faster than text. This makes me question who wouldn't want to use infographics to show data!
Having a go
I created an infographic to display the data from my professional blog. There were so many infographic creator sites online, but I chose to use Canva. Instead of using a template I decided to create mine from scratch as I had an idea of how I wanted to lay out my infographic. There were lots of icons, images, charts and shapes to choose from, but the only thing that bothered me was that the charts were not editable, I had wanted to use a Pie Graph to display the countries of my visitors, however I discovered it was a set image that could not be edited. I had heard that Piktochart allows you to edit your charts, which I will keep in mind for the future.
Why use it in the classroom?
Fun way to display information which would normally be in the form of lengthy sentences.
Infographics grabs readers attention through its use of images and colour and short pieces of writing.
You don't have to be an artist or very creative to feel successful in your creation.
You can choose from a wide variety of templates to get you going and get some inspiration.
Student's perspective
I actually finished creating this infographic whilst supervising a group of GIS students at a chess tournament. When they saw what I was creating they were all really interested in what I was creating. They liked the way it looked and had said they would like to do something like this in their learning. One of the students said an infographic about their blog posts would be a cool thing to create and have on their blogs and classroom. Such an activity could empower, excite and motivate my learners to continue to share their learning on their blog. I am looking forward to finding more ways to use infographics in the classroom.
This is my reflection of my experiences as a BT in the MDTA so far. I had wanted to create a reflection which portrayed my personality and experiences honestly and accurately. I had decided to not use a script when filming, as I wanted it to appear genuine and more conversational rather than interview-like. However I had forgotten to mention a lot of things, so I had to film some more this weekend (which explains the change in camera angle and different background). A big thanks to Juliana who helped me film.
I am thoroughly enjoying being in the MDTA and have learnt so many new things which I have been applying in my teaching. I'm looking forward to continuing to learn how to use digital technologies to accelerate my learners and get them excited about learning.
This week I have been continuing to extend my learner's understanding of algebraic patterns and rules. It has been so awesome watching my learners confidence grow as they became more familiar with the process of finding a rule for a pattern. What I also noticed is the level of engagement and enthusiasm of my learners. The kids were hooked in and loving the challenges, as I gradually provided less support and created more complex patterns. Also, learners who were quick to find the rules were able to help explain and teach the other group members, which was great to see.
I had continued to use materials when teaching my lessons, which I think contributed to the level of engagement and enthusiasm. The learners were able to notice patterns as they recreated the patterns made out of post-it notes and felt pens. I sat back and listened to the learners and noticed that as they were recreating the patterns they were discussing what they were noticing about the rules. I think that these discussions strengthened their understanding of algebraic patterns and rules.
At the end of my guided lesson on Tuesday my learners were tasked with the challenge of creating their own algebraic rules and patterns. This allowed learners to use what they had learnt over the past two weeks and apply it in a new situation. They had to think carefully when creating the patterns as they had to make sure that it would fit with their rules.
Next week I will extend my learners further, by teaching them level four algebra. I will continue to use hands-on methods of teaching as I have found that this is really effective with my learners.
This week in mathematics I am have been teaching algebraic patterns and rules to the the higher level students in my classroom. Figuring out patterns and rules can be quite tricky. Even I am not the most confident when it comes to upper primary mathematics, especially algebra. Therefore I decided to make my lessons hands-on, so the learners could physically make the patterns. It was my hope that by making the 1st, 2nd, 3rd and 4th phase of a pattern, they would begin to notice patterns and make connections to algebraic thinking.
We started off with determining the number of sticks used in a phase of a pattern. We began with a triangle pattern. The students quickly noticed that the number of sticks were increasing by 2, however this was not enough to create the 'rule'. After the students tested out their theories, I illustrated that the triangles could be split into groups of two, with one extra stick left over. Seeing the connection between the broken up sticks and the number of triangles helped them to notice the rule, n= (nx2) +1. After identifying the rule the learners were able to predict the number of sticks needed for the 8th, 27 and 38th pattern.
Following this, we moved on to a square pattern. I prompted the learners to think back to how we split up the triangles, and think about how they could split up the squares in a similar way. Some of the learners instantly 'saw' how they could split up the squares, whilst some tried other ways. This prompted discussions on why the learners chose to break the squares the way they did, and whether it would give us a rule for the number of sticks. This lead them to discover that the sticks should be split into groups of 3, with 1 left over; giving the rule n = (nx3) +1. Discussion was an important element of the lesson as it allowed learners to share their thoughts and justify their answers
I was surprised with how fast my learners were identifying the sequences and rules of the patterns, so I posed one more pattern to my learners. It was in the shape of a house, with 6 sticks. Most of the learners quickly figured out a rule to count the number of sticks in the sequence. Following this my learners created a DLO that teaches someone else about calculating rules for triangle and square path patterns. It was the first time that they had created a DLO in maths, but they did very well. Here are two examples of the DLOs created after this lesson. You can visit their blog posts by clicking on the images
My learners grasped the concept of finding a rule really well. I am looking forward to challenging my learners with some more complex patterns and rules.Next I will move onto more complex patterns and get them to create their own patterns that follow an algebraic rule.
Today was quite possibly the best Digital Immersion day I have had to date. We were set with the task of creating a stop motion movie to teach our learners an idea or concept. I chose to create a stop motion based on beach safety and rips, as it will fit into our aquatics inquiry.
Whilst the movie doesn't look like much, it took a lot of planning, creating and editing! An important lesson I learnt is if you are using a newer model iPhone, take the 'live photo' capability off before you start taking pictures. I got a big shock when I uploaded my photos onto my mac and discovered every image was a 3 second clip! But with some playing around I found a way to turn the live photo off and upload it using iPhoto Library (instead of the Photos app that pops up automatically).
Creating my backdrop
To create this stop motion I first created my beach scene by taking photographs of my 'waves' crashing onto the shore. After uploading the images to iMovie, I changed the duration of each image and saved it as a file. I then created a new iMovie and imported the clip of my waves crashing. Next, I copied the clip, and changed the second one to 'reverse', as I wanted the waves to roll in and out. Then I copied the two parts and pasted it numerous times so that the waves would be continuously rolling in and out throughout my clip. Then I saved this as Beach Scene.
So. Many. Photos!
Next came the task of taking photographs of my characters with speech bubbles. This took a lot of time. I first created my 'green screen' background and foreground. Next I wrote out all the speech bubbles. Following that, I began taking photographs of my characters and the speech bubbles. I took over 200 photos, making slight movements of my characters and the speech bubbles. After this I uploaded my images from my phone onto my computer, and then onto iMovie.
I then had to adjust the speed of some of my photographs. This took a lot of time because some of my speech bubbles had a lot in them, so I needed to make sure my learners would have enough time to read them. After this, I saved the iMovie and labelled it 'Green screen'.
Next I had to put it all together. I created another iMovie and imported the Green Screen and Beach Scene files. I placed the Green Screen file on top of the Beach Scene, and changed the overlay to 'Green/Blue Screen'. At times you could see the creases in the paper of my background/foreground and stick I used for the speech bubble, so I had to fix this using the eraser tool. Lastly, I added a sound clip.
And it's finished!
There are a few things I am unhappy with (like the occasional finger and watch strap making an appearance on screen and that I didn't quite place the green screen and characters in the perfect place), but overall I am pretty pleased with how it turned out. It was lots of fun and I thoroughly enjoyed the challenges that arose when creating a stop motion movie.
Today in digital immersion the MDTA learnt all about iMovie. Our task was to create an iMovie about our learners. I chose to focus on how my learners use Manaiakalani's 'Learn Create Share' pedagogy in their learning process. I didn't have a lot of video footage so I created my own screencasts and included a DLO from one of the groups in my classroom. Enjoy my movie!
Our focus for our Digital Immersion day last week was 'Create to Learn'. We were tasked with creating an 'explainer' video to show our inquiry focus. I chose to create something similar to RSA Animate, but I was cheeky and found images online as I cannot draw to save myself. It is not perfect and I have noticed that I need a question mark on the first slide, oops! However I really enjoyed this task. It was quite time consuming! I saved a ridiculous amount Google Draws as JPEGS and imported them all onto iMovie. Then I had to decrease the time for each frame and change the cropping from 'ken burns' to 'fit'. Following that, I recorded the voice over. After a few touch ups of the timing of the frames (so they matched the audio) I was finished!
I may be a little late to the game, but I am now a Google certified Educator! On Friday I sat down at my computer and began the daunting 3 hour level one Google exam. I was pleasantly surprised by how much I knew! I can definitely attribute that to my learning during digital immersion days with Dorothy. All our learning about Docs, Sheets, Forms and Sites came back to me, and made the 3 hour ordeal much less challenging than I had expected. I also think teaching (and continuously learning) in a digital classroom for a term has given me a better understanding of how we can use Google to engage and accelerate our learners.
Today we learnt how to take still images like a pro! We learnt about the rule of thirds, lighting and composition. With our newly acquired knowledge we set off for a little field trip. I had a look around Glenn Innes and got inspired to take photographs of street art in the community.
Next we uploaded them to our Google Drive. I had always thought that uploading photos was a hassle as I didn't know of a quick way to transfer them my phone, to my computer and to my site. Using the Google Photos app on your phone is a super quick way to transfer photographs. We also discussed how to embed folders on Google Sites, which got me thinking about how I could use this in my class. During mathematics I take lots of photographs of the learners. I had intended to create a digital modelling book to keep a record of what we were learning, but I had completely forgotten to do this. Now I know of a fast way to get my photographs onto my computer I will add a modelling book onto my mathematics page.
Lastly we used Pic Monkey to create a collage, and YouTube to create a collage to share our photographs. Some of my photographs needed cropping, so I used iPhoto to do this. It was fun playing around with the slideshow options on YouTube. I like how you can choose from a wide range of royalty-free songs and change the transitions to suit the style of the photographs.
On Tuesday this week my mentor and I taught the Current Events lesson that I had created during my MDTA Digital Immersion days. With the Current Events page up and running I was ready to go. After discussing my lesson, Robyn and I made some tweaks. We also decided that I would take the lead the first part of the lesson, we would team teach the next, and Robyn would lead the last part of our lesson. Here is a link to my multi-modal page that I created using HTML. Attached to the page is my teaching DLO and teacher notes.
Learning intentions
To identify the 5Ws of a current event
To identify and explain the point of views of groups involved in a current event
To understand there are two sides to a provocation
Connecting to the learners
Perhaps the most important part of my lesson was one of the first things I did - connecting to the learners. In order to be fully engaged and immersed in a lesson, I believe learners need to understand why they are learning something and have some form of connection to the learning. I had to come up with a way to connect the bus strikes to my learners lives. I knew that every Friday LS2 hops on a bus and travels to Technology at Tamaki College. In my lesson I asked my learners to think-pair-share what would happen if their bus driver didn't turn up to take them to tech. The classroom erupted with discussion.From this question, the learners understood that the Auckland bus strikes was something that could have been affected by and were interested in the current event.
The provocation
Learning Space 2 is very passionate about what is fair and right. I used this knowledge to form my provocation questions.
Is it fair for bus drivers to go on strike?
Is it fair to make bus drivers work longer hours but get less pay?
I encouraged the class to consider how they would feel if their bus driver didn't pick them up, and how would feel if their family members were made to work longer hours for less money. This again helped connect the learners to the current event as they were able to consider how they would have felt if they were involved in the Auckland Bus strikes.
Introducing the Auckland bus strikes
Instead of making my learners read an article or listen to myself explain the current event, I chose to use a recording from a radio news bulletin. Here is the link. Whilst the learners were engaged and listening to the recording, I could have directed their focus and gave them a purpose when listening to the recording. Next time I would display a question on the Apple TV whilst playing the recording, as it would have given them a specific focus when listening to the news bulletin.
Exploring the multi-modal site
The learners were set with the task of exploring the current events page and collaboratively filling out the 5Ws and H of the Auckland bus strike task. Robyn suggested that we use an existing task that is in our reading rotations, and add in 'point of view' section. This was effective as the learners already were familiar with the 5Ws of a current event. The learners filled in the 5Ws and H section and left the point of view part for after our class discussion. I did hint for the learners to look at what 'point of view' means by looking at the Current Events page. The multi-modal site was a site which catered to all learners and their abilities. The site consisted of audio clips, images, short sentences, extended paragraphs and video clips. This meant that all learners could get an understanding of the current events issue. Students who struggle with reading could listen to the audio clip, look at the images and watch the audio clip and gain an understanding of the Auckland bus strikes. This was a crucial element of my current events lesson. All learners were able to take part in the lesson and make meaning of the current events issue. I also spoke about the affordances of a multi-modal site here.
Dialogic discussion
After collaboratively filling out the 5W and H sections of their task, the class came together to share their ideas. The students led this part of the lesson as they shared their ideas with the class. My role was to get them to explain their responses and encourage further discussion of the ideas learners shared.
Exploring Bias
There is always two sides to every story...
Robyn and I team-taught this part of the lesson, which was an effective way to introduce the idea of bias. We unpacked the meaning of bias and explained it in the context of the Three Little Pigs. Robyn and I modelled the different points of view in the Three Little Pigs. I took the point of view of the three little pigs, and Robyn took the point of view of the mother. I explained that my point of view was that the wolf was the 'bad guy' because he destroyed their homes. Robyn responded to by saying that as the wolf's mother, she believed the pigs were the bad guys because the pigs had murdered her son.
Point of view
We got our learners had to consider the people and groups involved in the Auckland bus strike. We unpacked the meaning of point of view and asked the class to think-pair-share the point of views of the public and the bus drivers. We recorded the responses and encouraged the learners to use full sentences and justify their ideas by saying because... Getting our learners to explain their thinking by using because made them think more critically about their ideas, as they had to draw on evidence and their own opinion to justify their ideas.
Task two
Robyn took the lead in this aspect of the lesson. The learners had work with a partner and choose a group involved in the Auckland bus strikes. The class decided that the main groups involved were bus drivers, the public, bus drivers' bosses and the police. Their task was to use ifaketext to have a 'polite argument' between two different groups. Both groups had to share their point of view and make sure they explained why they held their point of view. Robyn revised the meaning of provocation, bias and point of view. The challenge of the task was to provide a clear explanation of the meaning of provocation, bias and point of view.
Student's work
Here are some screenshots of my learners completed tasks. If you click on the image you will be taken to their individual blog post. Sorry the quality isn't the best
Overall I was very pleased with how the current events lesson went. The learners were hooked into the lesson and engaged in all aspects of the task. I will definitely be doing another current events lesson like this in the near future.
Today we consolidated our learning and understanding of Google Sites, HTML and critical thinking in current events through the creation of a current events page. The 2016 MDTA cohort was set with the challenge of each creating a multi-modal page on Google Sites about a current event. In previous weeks we discussed critical thinking in social studies and reading, and chose current event topics. We then had a week to come up with the content of the lesson.
I found creating my change challenging but very addicting! After plenty of trials and errors, it was a great feeling to correctly fix something using HTML. A challenge I had was that I wanted to unmerge cells that had previously been merged together. This was tricky as when you merge cells you need to delete another. Merging cells shifts the one cell to take up the space of two cells, therefore you are left with an odd cell that is to the right of your table.
Merging Cells using HTML
Merge rows by adding the code rowspan="(number)" inside the <tb> code of the cell you want to merge
This shifts the cell to the right of the table. You then need to delete that entire cell.
Unmerging and Adding Cells
When you want to unmerge and add a row back in again you are left with a gap where it should have been. After some thinking and reading of the HTML I had, I figured how to add a cell back in by writing the codes <td> and </td> below the code for the previous cell.
You can unmerge cells by changing the rowspan code to rowspan"1". However this leaves you with a blank space where the previous cell was deleted.
Place some x's in the column next to the blank space. This shows where you want to create a new column.
Find the x's to locate where you need to add in a column. Insert <td> and </td> underneath the previous </td> for the xxxx column
Whilst this may have been very simple problem to solve for HTML savvy people, it was quite the accomplishment for someone who had no idea about HTML two weeks ago!
My Current Events Page
Here is the page I created using HTML. Please note that it is not entirely finished. I would like to increase the white cell padding and change the vertical alignment within each cell to be centered. I am still on my HTML learning journey and will fix it when I figure out how to. Click on the screenshot below to explore my page :) .
I will be using my multi-modal current events page with my learners next week.